 Prometheus监控系统对接钉钉告警通知
# 一、项目介绍
该项目基于prometheus-dingding (opens new window)改造,主要新增自动触发dump操作,pod异常时获取对应pod事件,目前只适配k8s集群中部署,源码仓库地址点击直达 (opens new window)
# 1.1 对接钉钉
自定义webhook系统,alertmanager接入至钉钉群,可根据不同label配置告警信息至不同的钉钉群,防止多业务通知同一个钉钉群,出现消息轰炸,时间一长,会导致人员对告警信息感到麻痹,从而错过重要信息。
1
# 1.2 告警静默
需借助 数据库 保留告警状态,暂未启用,直接使用repeat_interval实现,默认静默4小时
1
# 1.3 自动dump
currentvalue: $value注意该标签位置,因为当前值是不断变化的,因此不能放在label中
当pod内存达到设定预警值时,触发应用层面dump,并发送钉钉预警,以分析内存占用详情,告警项中需要配置以下标签:
# labels标签中
jvm_dump: "ture"
# annotations标签中
currentvalue: $value
1
2
3
4
5
2
3
4
5
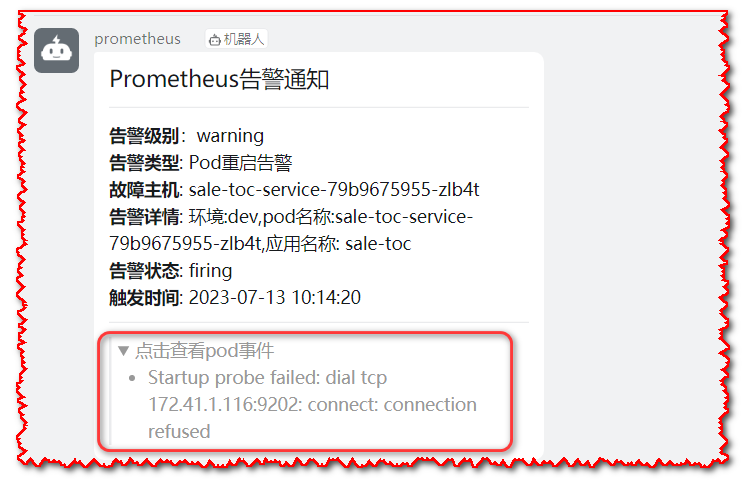
# 1.4 pod事件
pod事件主要是针对pod的告警项,当判断标签中有pod选项标签时,会查看当前pod的事件,只会取`type=Warning`的信息。
类似以下命令:
kubectl describe pods -n ${namespace} ${podname}
kubectl get events -n ${namespace}
1
2
3
4
2
3
4
# 二、项目配置
# 2.1 项目配置
- etc/app.yaml
app:
  host: 0.0.0.0
  port: 18084

log:
  level: INFO
  fileName: "./logs/app.log"
  maxSize: 10
  maxAge: 7
  maxBackups: 10
  comPress: false

# 钉钉群机器人token配置 根据token值 把对应的告警信息发送至钉钉群中
dingtoken:
  ## alertmanager对应webhook地址 http://${IP}:${PORT}/api/dingding/tfwms
  tfwms: "**************************"
  ## alertmanager对应webhook地址 http://${IP}:${PORT}/api/dingding/tfpos
  tfpos: "**************************"

jvm:
  # 是否开启dump操作,是指在容器内存达到85%小于90%时,触发jvm dump操作,默认不开启
  is_dump: false
  # 内存使用率: 执行dump时 内存使用率最大值和最小值,如果pod内存使用率过高 执行dump操作可能会导致pod重启 这个值根据pod实际内存限制配置
  dump_min: 85
  dump_max: 90
  # 告警时间: 执行dump最大时间和最小时间 指的是当前时间距离发生告警是否超过24h并且小于28h,对于同一个告警,alertmanager默认的静默时间为4H(repeat_interval控制),确保最大时间与最小时间与之匹配,防止重复dump
  # ## 如果想要配置一次预警就dump,则最小时间设置为0;如果设置为0,那么最大时间就需要配置为4,以防止重复dump
  dump_ts_min: 24
  dump_ts_max: 28
# 应用判断告警项时 标签名称
# 对应的是 Prometheus告警规则中自定义的labels名称 这里之所以抽出来,是为了方便自定义标签,可以更加准确获取告警规则信息
promlabels:
  # 用于 定义触发该告警项时 导出对应pod jvm快照 这里等于是告警项中定义标签 jvm_dump="true"
  jvm_labels: "jvm_dump"
  # 用于 定义触发该告警项时 是否获取告警项的对应资源事件(目前只支持pod事件) 这里等于是告警项中定义标签 pod="*"
  event_labels: "pod"
1
2
3
4
5
6
7
8
9
10
11
12
13
14
15
16
17
18
19
20
21
22
23
24
25
26
27
28
29
30
31
32
33
34
35
36
2
3
4
5
6
7
8
9
10
11
12
13
14
15
16
17
18
19
20
21
22
23
24
25
26
27
28
29
30
31
32
33
34
35
36
# 2.2 alertmanager 配置
# 针对以上etc/app.yaml配置文件dingtoken参数配置,对应的alertmanager配置如下
global:
  resolve_timeout: 1m

route:
  receiver: 'default-receiver'
  group_by: ['alertname']
  group_wait: 10s
  group_interval: 2m
  repeat_interval: 1h

  routes: # 定义路由
  - receiver: "web.hook.tfwms"
    match:
     # 匹配含有team: tfwms标签的告警项,把搞告警信息发送至下面对应的接收者
     # 该标签 Prometheus自定义,或者自行根据已有标签来区分不同业务模块即可
      team: tfwms

receivers:
- name: 'default-receiver'
  webhook_configs:
  # 该webhhok地址需要与dingtalk警项目中配置文件的dingtoken.tfpos对应
  - url: 'http://dingtalk-hook-svc:18080/api/dingding/tfpos'
    send_resolved: true
  - name: 'web.hook.tfwms'  # 上面路由匹配到后 发送到对应的webhoook地址
   webhook_configs:
   # 该webhhok地址需要与dingtalk警项目中配置文件的dingtoken.channel对应
   - url: 'http://dingtalk-hook-svc:18080/api/dingding/tfwms'
     send_resolved: true
inhibit_rules:
  - source_match:
      severity: 'critical'
    target_match:
      severity: 'warning'
    equal: ['alertname','instance']
1
2
3
4
5
6
7
8
9
10
11
12
13
14
15
16
17
18
19
20
21
22
23
24
25
26
27
28
29
30
31
32
33
34
35
2
3
4
5
6
7
8
9
10
11
12
13
14
15
16
17
18
19
20
21
22
23
24
25
26
27
28
29
30
31
32
33
34
35
# 2.3 Prometheus 告警规则
prometheus-prometheusRule-custom.yaml
apiVersion: monitoring.coreos.com/v1
kind: PrometheusRule
metadata:
  labels:   # 标签需要与prometheus资源清单中ruleSelector对应
    prometheus: k8s
    role: alert-rules
  name: prometheus-rule-custom
  namespace: monitoring
spec:
  groups:
  - name: "kubertenes-pods"
    rules:
    - alert: pod 内存使用率95%预警
      expr: sum (container_memory_working_set_bytes{container !="",container!="POD"}) by (container, pod,namespace)/ sum(container_spec_memory_limit_bytes{container !="",container!="POD"}) by (container, pod,namespace) * 100 > 95
      for: 5m
      labels:
        severity: warning
        team: tfwms
      annotations:
        summary: Container Memory usage (instance {{ $labels.instance }})
        description: '应用:{{ $labels.pod }} 内存使用大于95%,当前值: {{ $value | printf "%.2f" }}'
    - alert: pod 内存使用率85%预警
      expr: sum (container_memory_working_set_bytes{container !="",container!="POD"}) by (container, pod,namespace)/ sum(container_spec_memory_limit_bytes{container !="",container!="POD"}) by (container, pod,namespace) * 100 > 85
      for: 5m
      labels:
        jvm_dump: "true"
        severity: warning
        team: tfwms
      annotations:
      	currentvalue: "{{ $value }}"
        summary: Container Memory usage (instance {{ $labels.instance }})
        description: '应用:{{ $labels.pod }} 内存使用大于85%,当前值: {{ $value | printf "%.2f" }}'
1
2
3
4
5
6
7
8
9
10
11
12
13
14
15
16
17
18
19
20
21
22
23
24
25
26
27
28
29
30
31
32
2
3
4
5
6
7
8
9
10
11
12
13
14
15
16
17
18
19
20
21
22
23
24
25
26
27
28
29
30
31
32
参数解读
- 这里配置了2个告警项,85%和95%,当然,两个告警规则功能和标签是有区别的。
- 对于85%的预警,这个主要就是用来提前dump应用的内存快照的,只要大于85,无论是否触发dump,这个告警项都不会发送到钉钉群中(当然,dump成功后的钉钉发送还是正常的),此值需要与项目配置文件中
jvm.dump_min对应,并且需要有jvm_dump和currentvalue标签。 - 对于95%的预警,这个就是普通的针对pod级别内存预警的,只有达到预警时间,则会发送至对应钉钉群中。
- 这里之所以配置一个85,一个95的告警规则,是因为如果只使用95那么执行dump有可能会导致pod重启。
- currentvalue: 此标签不能放在labels中,因为这个值是变化的,如果放在labels中,对于同一个告警会导致
fingerprint一直变化,导致该告警项一直处于PENDING状态。
# 2.4 dump 配置
需要准备dump脚本,如果你能确定pod中应用的主进程,比如都是1,则直接执行导出命令即可,无需配置脚本
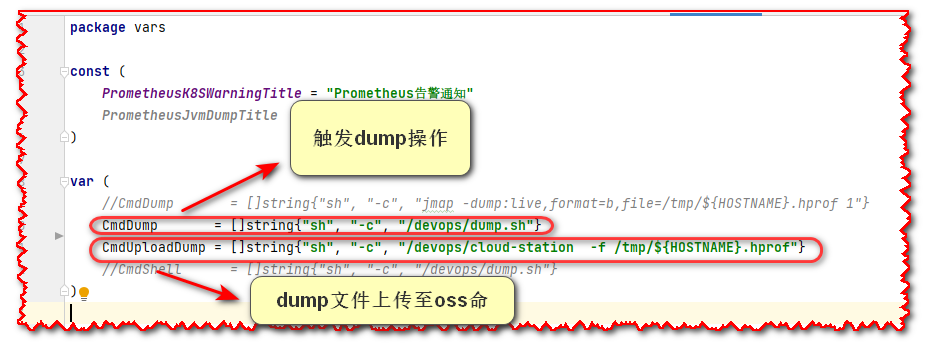
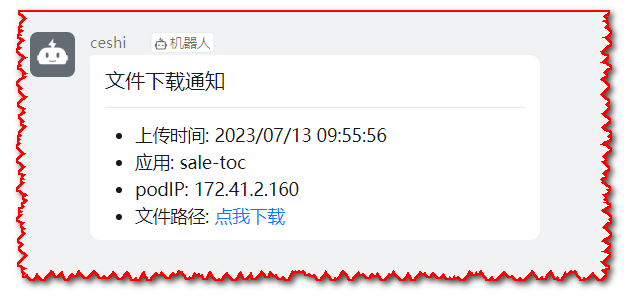
这里是指当要触发dump操作时,会调用dump脚本(一个shell脚本),把应用内存快照dump出,然后会调用cloud-station命令,把dump文件上传至配置的oss中,并返回oss地址,以供开发人员直接下载,因此这两个脚本需要在pod中存在,并存放于这个位置: /devops/目录下,关于cloud-station脚本内容查看cloud-station源码地址 (opens new window),更多使用使用查看cloud-station云商中转站 (opens new window)
如果想自定义dump相关操作脚本位置,则需要自行修改项目源码vars/vars.go中CmdDump参数,具体参数看截图:
点击查看 dump.sh脚本
#!/bin/sh

PID=$(ps -ef|grep "${appName}"|grep -v grep|awk '{print $1}')

if [ -z "${PID}" ]
then
	echo "未获取当前容器PID"
	exit 0
fi

# 只转存活着的对象
jmap -dump:live,format=b,file=/tmp/${HOSTNAME}.hprof ${PID}
# ## 转存所有对象
# jmap -dump:format=b,file=/tmp/${HOSTNAME}.hprof ${PID}
1
2
3
4
5
6
7
8
9
10
11
12
13
14
2
3
4
5
6
7
8
9
10
11
12
13
14
# 三、构建安装
# 3.1.1 构建
# 拉去代码
https://github.com/tchuaxiaohua/alertmanagerDingNodify.git
# 构建镜像
cd alertmanagerDingNodify

# ## 基于Dockerfile 构建镜像
docker build -t huahua5404/dingtalk:v1 .
1
2
3
4
5
6
7
2
3
4
5
6
7
# 3.1.2 权限角色配置
apiVersion: v1
kind: ServiceAccount
metadata:
  name: pod-operator
  namespace: monitoring
---
apiVersion: rbac.authorization.k8s.io/v1
kind: ClusterRole
metadata:
  name: pod-role
rules:
- apiGroups: [""]
  resources:
    - pods/exec
    - events
  verbs: ["get", "list","create"]
---
apiVersion: rbac.authorization.k8s.io/v1
kind: ClusterRoleBinding
metadata:
  name: pod-role-binding
  namespace: monitoring
subjects:
- kind: ServiceAccount
  name: pod-operator
  namespace: monitoring
roleRef:
  kind: ClusterRole
  name: pod-role
  apiGroup: rbac.authorization.k8s.io
1
2
3
4
5
6
7
8
9
10
11
12
13
14
15
16
17
18
19
20
21
22
23
24
25
26
27
28
29
30
31
2
3
4
5
6
7
8
9
10
11
12
13
14
15
16
17
18
19
20
21
22
23
24
25
26
27
28
29
30
31
# 3.1.3 k8s配置
# 配置文件,k8s kube-config配置
# ## 把项目配置文件和k8s config放到secret中【已放弃config模式授权】
# kubectl  create secret generic dingtalk-config --from-file=app.yaml=./app.yaml --from-file=config=./config -n monitoring
# 配置文件,k8s kube-config配置
# ## 把项目配置文件放到secret中或者configmap中
kubectl  create secret generic dingtalk-config --from-file=app.yaml=./app.yaml -n monitoring

# 创建pod dingtaLk-k8s.yaml
apiVersion: apps/v1
kind: Deployment
metadata:
  name: dingtalk
  namespace: monitoring
spec:
  replicas: 1
  selector:
    matchLabels:
      app: dingtalk
  template:
    metadata:
      labels:
        app: dingtalk
    spec:
      serviceAccountName: pod-operator
      containers:
      - name: dingtalk-hook
        image: huahua5404/dingtalk:v1
        imagePullPolicy: Always
        ports:
        - containerPort: 18084
          name: http
        volumeMounts:
        - name: dingtalk-config
          mountPath: /apps/etc/
          readOnly: true
        resources:
          requests:
            cpu: 50m
            memory: 100Mi
          limits:
            cpu: 50m
            memory: 100Mi
      volumes:
        - name: dingtalk-config
          secret:
            secretName: dingtalk-config
---
apiVersion: v1
kind: Service
metadata:
  name: dingtalk-hook-svc
  namespace: monitoring
spec:
  selector:
    app: dingtalk
  ports:
  - name: hook
    port: 18084
    targetPort: http
1
2
3
4
5
6
7
8
9
10
11
12
13
14
15
16
17
18
19
20
21
22
23
24
25
26
27
28
29
30
31
32
33
34
35
36
37
38
39
40
41
42
43
44
45
46
47
48
49
50
51
52
53
54
55
56
57
58
59
2
3
4
5
6
7
8
9
10
11
12
13
14
15
16
17
18
19
20
21
22
23
24
25
26
27
28
29
30
31
32
33
34
35
36
37
38
39
40
41
42
43
44
45
46
47
48
49
50
51
52
53
54
55
56
57
58
59
# 四、模版
# 4.1.1 模板介绍
1) 模板文件: "template/alert.tmpl"
2) 模板个别参数取值优先级说明(根据标签依次查找,如果都找不到则返回空):
    故障主机: pod > container > hostname > instance
    告警详情: Description > Summary
1
2
3
4
2
3
4
# 4.1.2 模板自定义
需要懂一点模版语法
告警模板内容都是基于标签进行赋值,如果想定义更丰富的模板则需要自己调整prometheus监控指标的标签值。
.Labels 获取的是指标的标签,如果想要自定义告警内容,告警值直接`.Labels.tag`即可,`tag`是对应的标签,按照MD文档格式,即可完成自定义告警模板。
1
2
2
# 4.1.3 内置模版
{{if eq .Status "resolved"}}
## Prometheus告警恢复
---
**告警级别**: {{ .Labels.severity }}

**告警类型**: {{ .Labels.alertname }}
{{if .Labels.pod }}
**故障主机**: {{ .Labels.pod }}
{{else if .Labels.container }}
**故障主机**: {{ .Labels.container }}
{{else if .Labels.hostname }}
**故障主机**: {{ .Labels.hostname }}
{{else if .Labels.instance }}
**故障主机**: {{ .Labels.instance }}
{{end}}
{{if .Annotations.Description }}
**告警详情**: {{ .Annotations.Description }}
{{else if .Annotations.Summary }}
**告警详情**: {{ .Annotations.Summary }}
{{ end }}
**告警状态**: {{ .Status }}

**触发时间**: {{ .StartsAt }}

**触发结束时间**: {{ .EndsAt }}

{{else}}
## Prometheus告警通知
---
**告警级别**:{{ .Labels.severity }}

**告警类型**: {{ .Labels.alertname }}
{{if .Labels.pod }}
**故障主机**: {{ .Labels.pod }}
{{else if .Labels.container }}
**故障主机**: {{ .Labels.container }}
{{else if .Labels.hostname }}
**故障主机**: {{ .Labels.hostname }}
{{else if .Labels.instance }}
**故障主机**: {{ .Labels.instance }}
{{end}}
{{if .Annotations.Description }}
**告警详情**: {{ .Annotations.Description }}
{{else if .Annotations.Summary }}
**告警详情**: {{ .Annotations.Summary }}
{{ end }}
**告警状态**: {{ .Status }}

**触发时间**: {{ .StartsAt }}

{{ if .Events }}
---
> <details>
>   <summary>点击查看pod事件</summary>
> {{ range .Events }}
> * {{ . }}
> {{ end }}
> {{ end }}
> </details>
{{ end }}
1
2
3
4
5
6
7
8
9
10
11
12
13
14
15
16
17
18
19
20
21
22
23
24
25
26
27
28
29
30
31
32
33
34
35
36
37
38
39
40
41
42
43
44
45
46
47
48
49
50
51
52
53
54
55
56
57
58
59
60
61
2
3
4
5
6
7
8
9
10
11
12
13
14
15
16
17
18
19
20
21
22
23
24
25
26
27
28
29
30
31
32
33
34
35
36
37
38
39
40
41
42
43
44
45
46
47
48
49
50
51
52
53
54
55
56
57
58
59
60
61
# 4.1.4 注意
如果想要把模版放到configmap(推荐)或者secret中,挂载的时候需要把cm映射到/apps/template目录下面,否则会因为找不到模版而失败。

# 示例
volumeMounts:
- name: dingtalk-config
  mountPath: /apps/etc/
  readOnly: true
- name: dingtalk-tml
  mountPath: /apps/template/
  readOnly: true
volumes:
- name: dingtalk-config
  secret:
    secretName: dingtalk-config
- name: dingtalk-tml
  configMap:
    name: dingtalk-tml
1
2
3
4
5
6
7
8
9
10
11
12
13
14
15
16
17
2
3
4
5
6
7
8
9
10
11
12
13
14
15
16
17
# 五、告警示例
# 5.1 应用oom通知样例
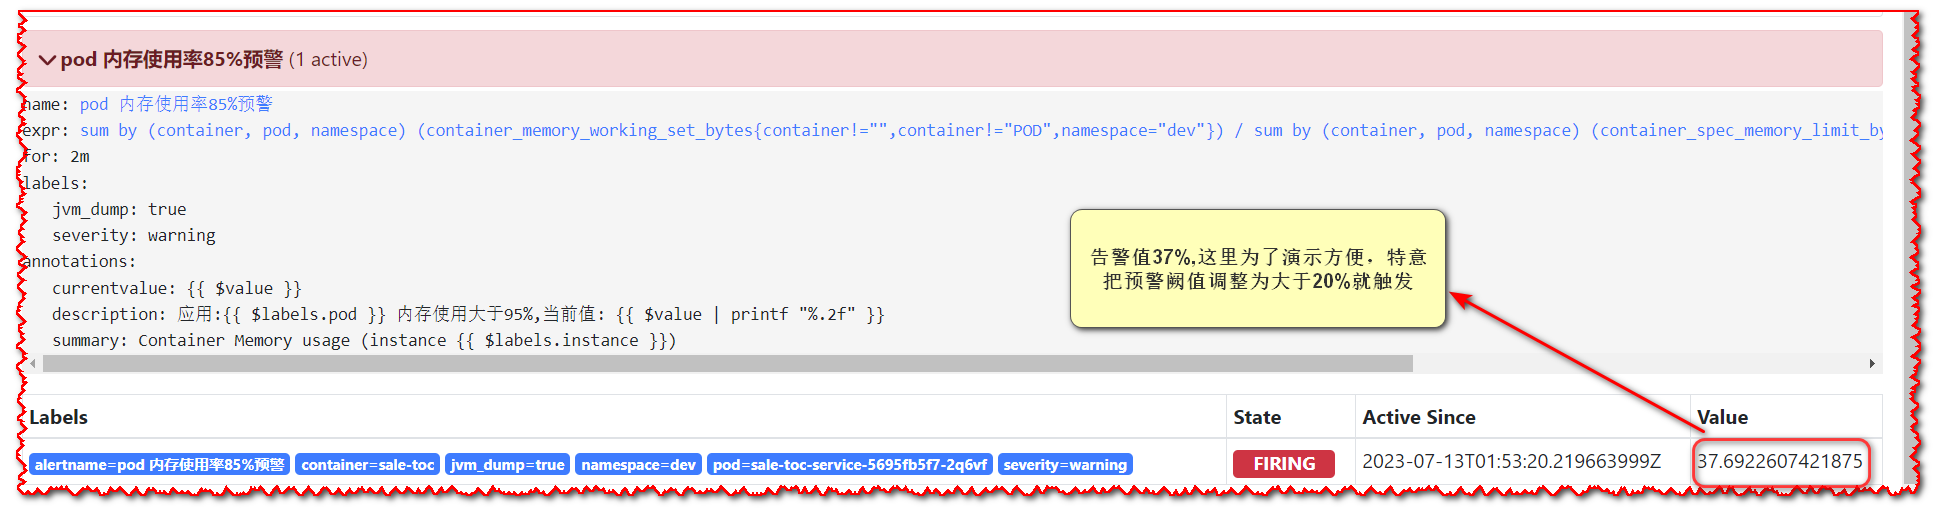
演示环境,配置的当值大于20%,小于40%触发dump逻辑
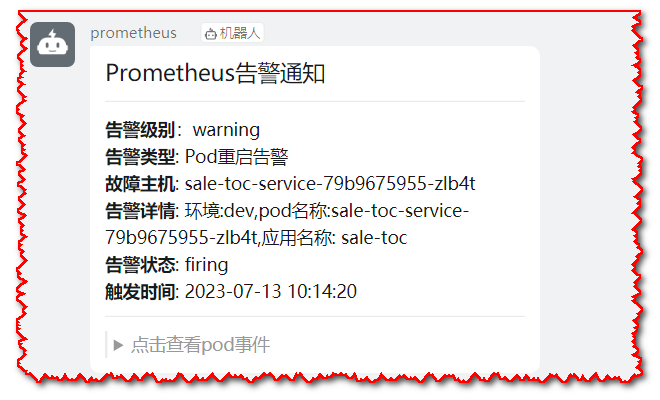
# 5.2 pod事件告警通知样例
当pod异常时,会把对应的事件带出来,可以更加快捷定位问题
编辑 (opens new window)
上次更新: 2024/04/12, 11:25:35