Prometheus客户端Exporter开发
# 一、概述
在Go语言中开发一个Prometheus客户端exporter,我们需要使用Prometheus的Go客户端库 (opens new window)来实现Metrics的采集和暴露。Prometheus客户端库提供了方便的接口来定义Metrics,收集数据,并将其暴露给Prometheus服务器。
# 二、概念介绍
# 2.1 Metrics数据格式
Prometheus exporter以文本格式暴露指标数据,称为"Exposition Format"。该格式是一种简单的文本格式,用于表示指标名称、标签和其对应的值。Prometheus可以通过HTTP协议从exporter的/metrics端点获取这些数据,数据格式如下:
# HELP jvm_memory_max_bytes The maximum amount of memory in bytes that can be used for memory management
# TYPE jvm_memory_max_bytes gauge
jvm_memory_max_bytes{application="co-identity-manage",area="nonheap",id="Compressed Class Space",} 2.60046848E8
jvm_memory_max_bytes{application="co-identity-manage",area="heap",id="Survivor Space",} 2.14695936E8
jvm_memory_max_bytes{application="co-identity-manage",area="nonheap",id="Code Cache",} 2.5165824E8
jvm_memory_max_bytes{application="co-identity-manage",area="heap",id="Eden Space",} 6.44349952E8
jvm_memory_max_bytes{application="co-identity-manage",area="heap",id="Tenured Gen",} 4.99122176E8
jvm_memory_max_bytes{application="co-identity-manage",area="nonheap",id="Metaspace",} 2.68435456E8
2
3
4
5
6
7
8
jvm_memory_max_bytes: 指标名称,用于唯一标识指标。application、area、id: 标签的名称和值,用于为指标添加附加的维度信息。
每个指标条目可以包含零个或多个标签,并且具有相同指标名称和相同标签名称及值的条目将被视为相同的指标。
# 2.2 Metrics数据类型
在Prometheus中,可以定义不同类型的Metrics来收集和暴露不同种类的指标。以下是Prometheus支持的常见Metrics类型:
- Counter(计数器)
Counter 是一个递增的整数指标,用于记录累积的计数。它通常用于表示事件发生的次数或处理的总量,示例数据:
# 用于记录HTTP请求的总数
http_requests_total{method="GET", endpoint="/api/users"} 100
http_requests_total{method="POST", endpoint="/api/users"} 50
2
3
- Gauge(仪表盘)
Gauge是一个可以任意增减的数值指标,用于表示一个可变的值。它可以表示瞬时状态或随时间变化的度量,示例数据:
# 用于记录CPU使用率的百分比
system_cpu_usage{instance="server1"} 75.2
system_cpu_usage{instance="server2"} 62.8
2
3
- Histogram(直方图)
Histogram是一个表示数据分布的指标。它将观测值按照配置的桶范围进行分组,并记录每个桶中的观测次数,示例数据:
# 用于记录HTTP请求的持续时间
prometheus_http_request_duration_seconds_bucket{method="GET", endpoint="/api/users", le="0.1"} 5
prometheus_http_request_duration_seconds_bucket{method="GET", endpoint="/api/users", le="0.5"} 10
prometheus_http_request_duration_seconds_bucket{method="GET", endpoint="/api/users", le="+Inf"} 15
prometheus_http_request_duration_seconds_bucket{method="GET", endpoint="/api/users"} 2.5
prometheus_http_request_duration_seconds_bucket{method="GET", endpoint="/api/users"} 15
2
3
4
5
6
- Summary(摘要)
Summary是一个用于表示数据摘要的指标。它会计算观测值的总数、总和和分位数,并提供可配置的滑动时间窗口,数据示例:
# 用于记录HTTP响应时间的摘要统计信息,如总数、总和和分位数
response_time_seconds{endpoint="/api/users", quantile="0.5"} 0.75
response_time_seconds{endpoint="/api/users", quantile="0.9"} 1.2
response_time_seconds{endpoint="/api/users", quantile="0.99"} 2.5
response_time_seconds_sum{endpoint="/api/users"} 50
response_time_seconds_count{endpoint="/api/users"} 100
2
3
4
5
6
# 三、指标
# 3.1 默认指标
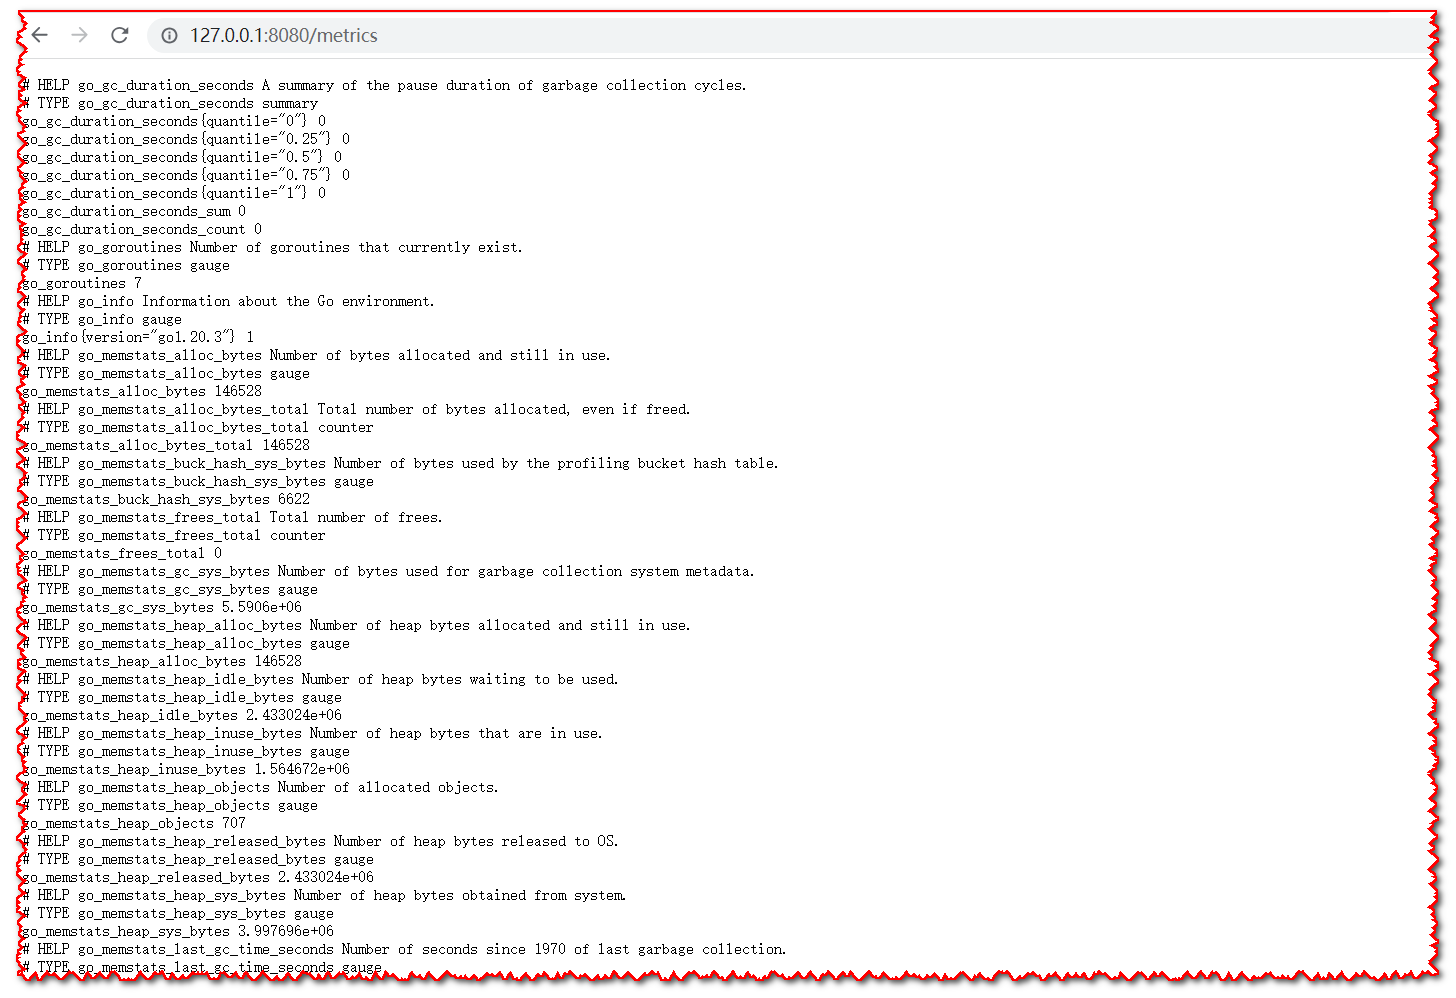
Prometheus exporter默认提供一些基本的指标,用于报告自身的运行状态和性能信息。这些默认指标通常以go_为前缀,并提供有关Exporter本身的信息。
这里我们使用Prometheus的SDK直接启动一个客户端示例,代码如下:
package main

import (
	"net/http"

	"github.com/prometheus/client_golang/prometheus/promhttp"
)

func main() {
	http.Handle("/metrics", promhttp.Handler())
	http.ListenAndServe(":8080", nil)
}
2
3
4
5
6
7
8
9
10
11
12
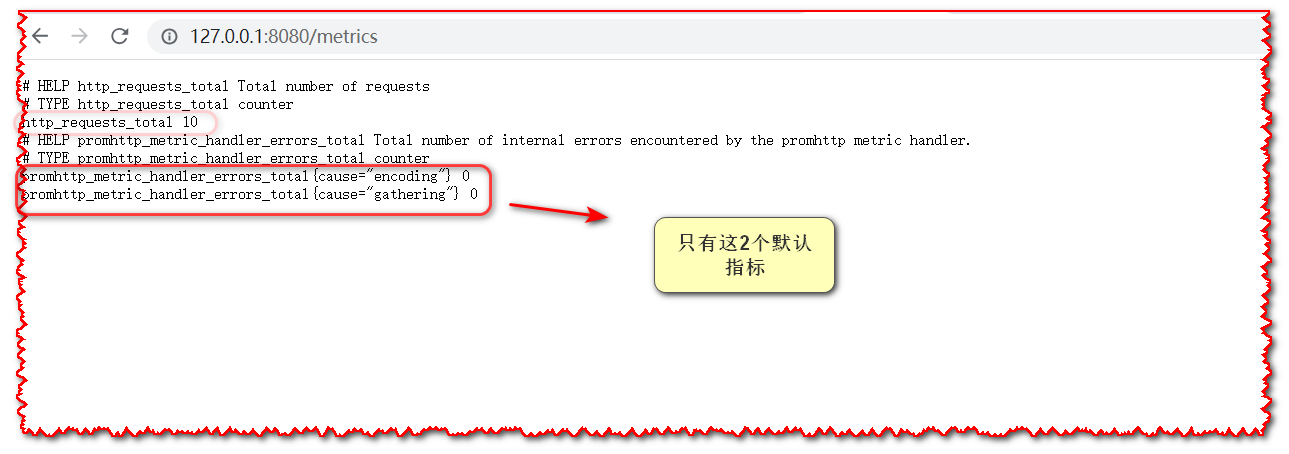
上面代码我们并没有定义任何业务逻辑,当我们访问时,可以看到也会有一些指标,这是因为 Go 客户端库默认在我们暴露的全局默认指标注册表中注册了一些关于 promhttp 处理器和运行时间相关的默认指标,浏览器访问: http://127.0.0.1:8080/metrics
# 3.2 自定义指标
在Prometheus exporter中,指标的采集是通过编写指标收集器(Metric Collector)来实现的。指标收集器负责定期收集和更新指标的值,并将其暴露给Prometheus进行抓取。
上面我们介绍过exporter数据类型主要有Counters、Gauges、Histograms、Summariess四种数据类型,四种数据类型指标,都有各自的构造函数,分别对应NewCounter、NewGauge、、
# 3.2.1 Counters
在Prometheus中,Counter是一种指标类型,用于表示单调递增的计数器。Counter指标通常用于记录事件的数量或累计计数
package main

import (
	"net/http"
	"time"

	"github.com/prometheus/client_golang/prometheus"
	"github.com/prometheus/client_golang/prometheus/promhttp"
)

var (
	requestCounter = prometheus.NewCounter(prometheus.CounterOpts{
        // 指标名称
		Name: "http_requests_total",
        // 指标描述
		Help: "Total number of HTTP requests.",
	})
)

func main() {
	// 注册指标
	prometheus.MustRegister(requestCounter)

	// 创建HTTP处理器并设置指标路径
	http.Handle("/metrics", promhttp.Handler())
    // 业务逻辑函数
	http.HandleFunc("/api", handleRequest)
	// 启动HTTP服务器并监听端口
	http.ListenAndServe(":8080", nil)
}

func handleRequest(w http.ResponseWriter, r *http.Request) {
	// 处理请求的逻辑 此处用来模拟请求次数
	for i := 0; i < 10; i++ {
		requestCounter.Inc()
	}
	// 增加Counter指标的值
	requestCounter.Inc()
}
2
3
4
5
6
7
8
9
10
11
12
13
14
15
16
17
18
19
20
21
22
23
24
25
26
27
28
29
30
31
32
33
34
35
36
37
38
39
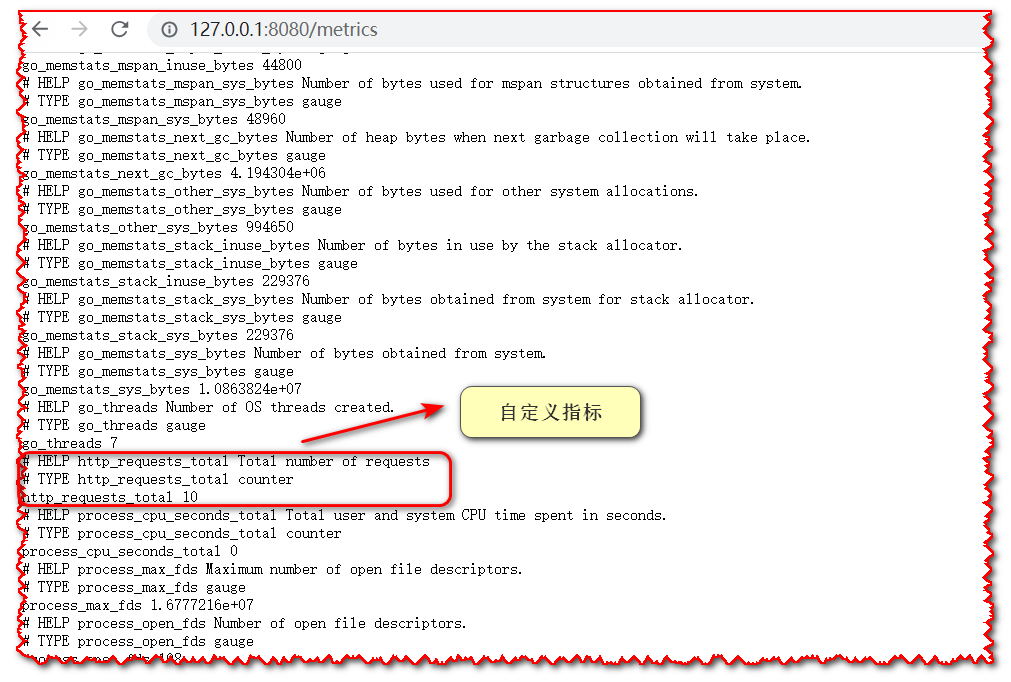
上面示例,当我们访问/api时,http_requests_total指标会增加10次访问。
说明
prometheus.NewCounter Counter指标构造函数
requestCounter.Inc() 增加Counter指标的值。每次处理一个请求时,我们将Counter指标的值递增。
requestCounter.Add(n),将Counter指标的值增加n,Add方法可以接受任意的float64参数,您可以根据需求传递适当的值进行增加。
# 3.2.2 Gauge
prometheus.NewGauge函数用于创建一个 Gauge 指标(即仪表盘指标)。Gauge 指标用于表示可任意增减的值,例如温度、内存使用量等。
package main
import (
"net/http"
"github.com/prometheus/client_golang/prometheus"
"github.com/prometheus/client_golang/prometheus/promhttp"
)
var (
queueLength = prometheus.NewGauge(prometheus.GaugeOpts{
Name: "queue_length",
Help: "The number of items in the queue.",
// 自定义指标 标签
ConstLabels: map[string]string{"application": "my-app"},
})
)
func main() {
prometheus.MustRegister(queueLength)
// 模拟queueLength数据
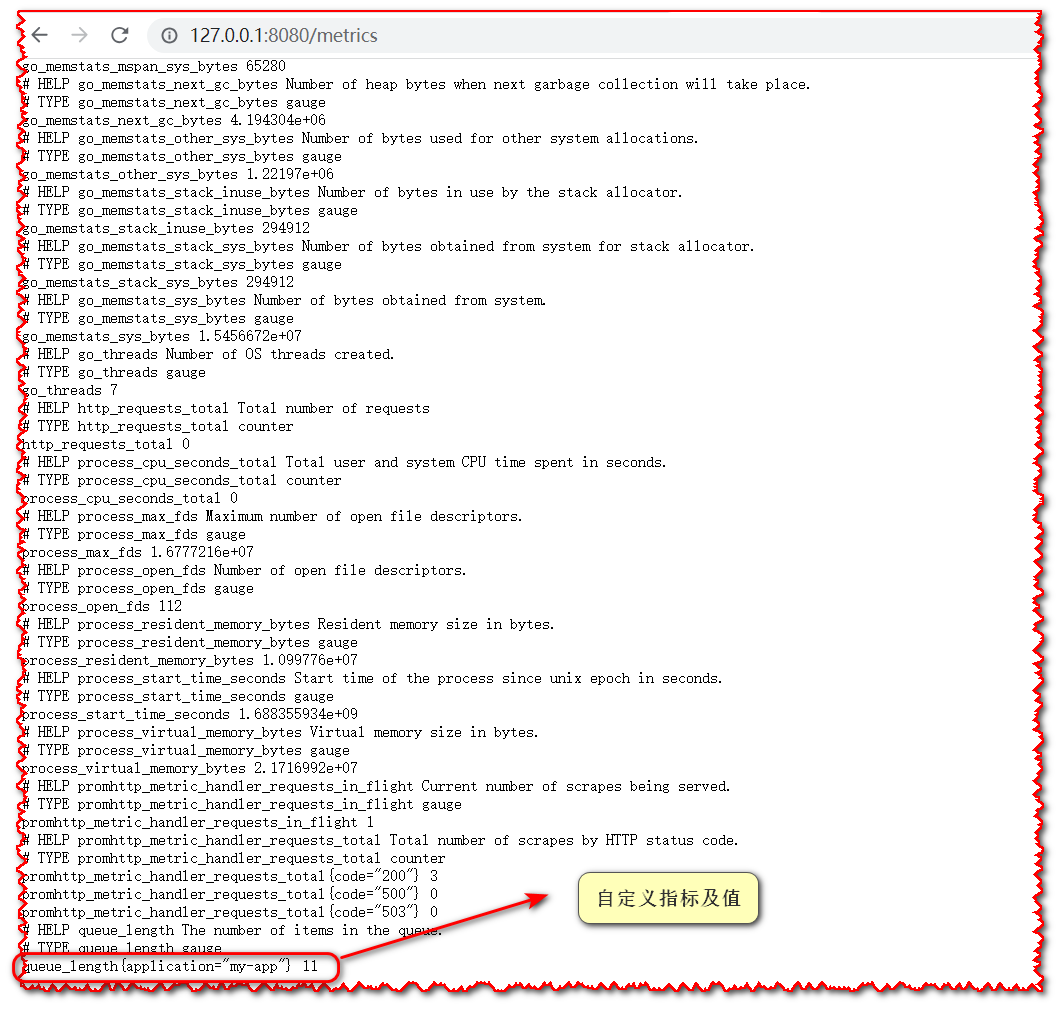
queueLength.Set(11)
http.Handle("/metrics", promhttp.Handler())
http.ListenAndServe(":8080", nil)
}
2
3
4
5
6
7
8
9
10
11
12
13
14
15
16
17
18
19
20
21
22
23
24
25
26
27
28
说明
queueLength.Set(11)设置指标的值,除了set还有其他方法Inc()gauge增加1Dec()gauge减少1Add(10)增加10个增量Sub(10)减少10个增量
# 3.2.3 Histograms
在Prometheus中,Histogram是一种指标类型,用于测量和统计观测值的分布情况,如请求延迟、响应大小等。Histogram指标会将观测值划分为不同的桶(buckets),并记录每个桶中的观测值数量。
要定义一个Histogram指标,您可以使用prometheus.NewHistogram函数。
package main
import (
"net/http"
"time"
"github.com/prometheus/client_golang/prometheus"
"github.com/prometheus/client_golang/prometheus/promhttp"
)
var (
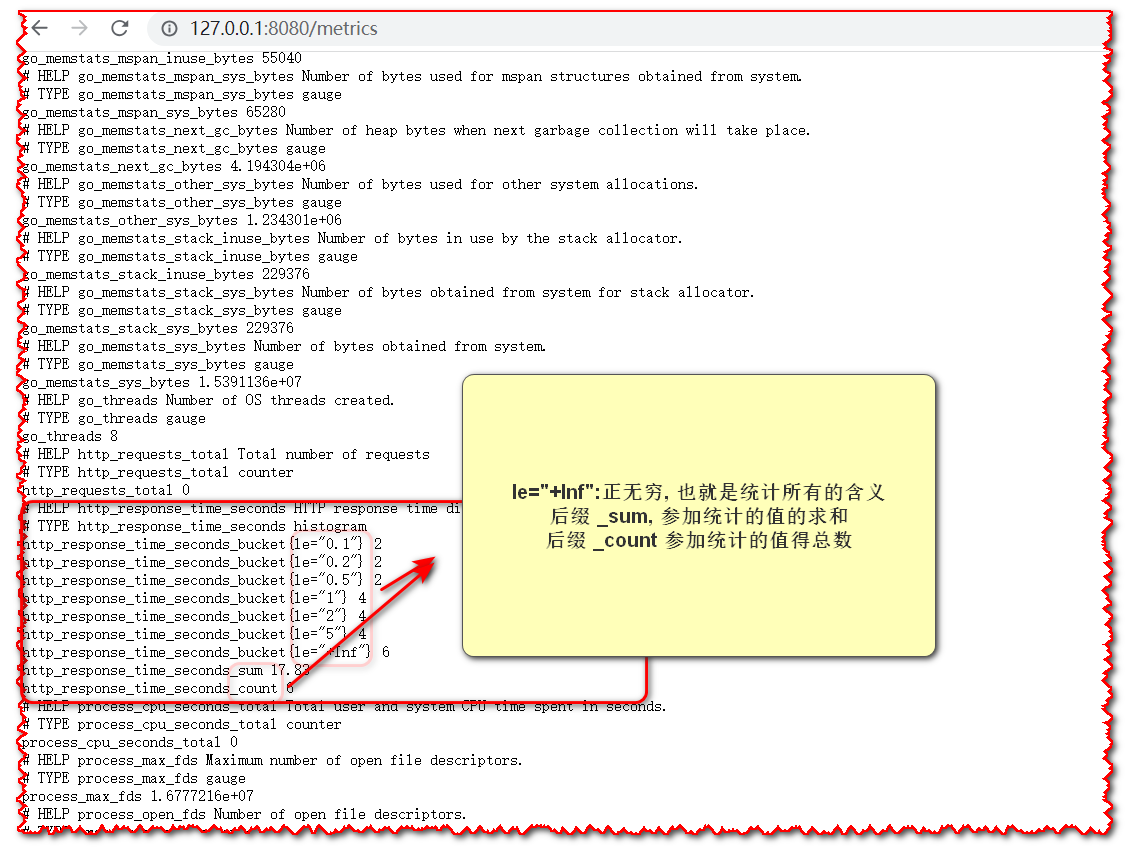
responseTimeHistogram = prometheus.NewHistogram(prometheus.HistogramOpts{
Name: "http_response_time_seconds",
Help: "HTTP response time distribution.",
// 表示0.1s内相应的的请求,一次类推最后一个表示在5s内响应的请求
Buckets: []float64{0.1, 0.2, 0.5, 1, 2, 5},
})
)
func main() {
// 注册指标
prometheus.MustRegister(responseTimeHistogram)
// 添加值
for _, v := range []float64{0.01, 0.02, 0.6, 0.7, 5.5, 11} {
resTimeHistogram.Observe(v)
}
// 创建HTTP处理器并设置指标路径
http.Handle("/metrics", promhttp.Handler())
// 启动HTTP服务器并监听端口
http.ListenAndServe(":8080", nil)
}
2
3
4
5
6
7
8
9
10
11
12
13
14
15
16
17
18
19
20
21
22
23
24
25
26
27
28
29
30
31
32
33
34
35
说明
prometheus.NewHistogram:Histogram指标构造函数Buckets: 是一个浮点数的切片,用于指定分桶的边界。上面每一个值用来统计在该时间内的请求数,这里类似于条形图的横轴resTimeHistogram.Observe(v):用于给边界值赋值,类似于条形图的从纵轴
# 3.2.4 Summaries
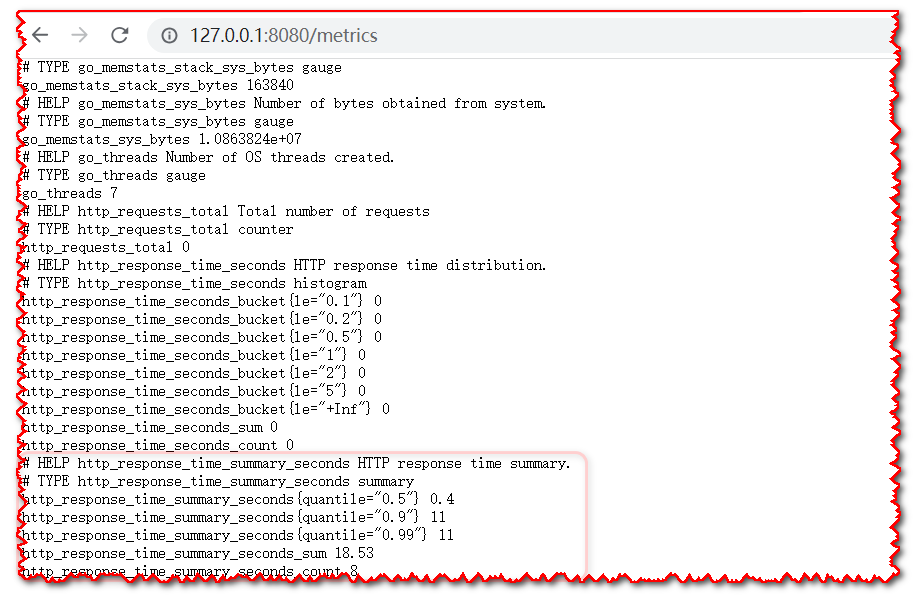
在Prometheus中,Summary是一种指标类型,用于测量和统计观测值的分布情况,类似于Histogram。但相比于Histogram,Summary会计算出分位数(quantile)和总和(sum),要定义一个Summary指标,您可以使用prometheus.NewSummary函数。
package main

import (
	"net/http"
	"time"

	"github.com/prometheus/client_golang/prometheus"
	"github.com/prometheus/client_golang/prometheus/promhttp"
)

var (
	responseTimeSummary = prometheus.NewSummary(prometheus.SummaryOpts{
		Name:       "http_response_time_summary_seconds",
		Help:       "HTTP response time summary.",
        // 每个分位数和其允许的误差范围。
		Objectives: map[float64]float64{0.5: 0.05, 0.9: 0.01, 0.99: 0.001},
	})
)

func main() {
	// 注册指标
	prometheus.MustRegister(responseTimeSummary)

    // 模拟添加值
    / 添加值
	for _, v := range []float64{0.01, 0.02, 0.3, 0.4, 0.6, 0.7, 5.5, 11} {
		responseTimeSummary.Observe(v)
	}

	// 创建HTTP处理器并设置指标路径
	http.Handle("/metrics", promhttp.Handler())

	// 启动HTTP服务器并监听端口
	http.ListenAndServe(":8080", nil)
}
2
3
4
5
6
7
8
9
10
11
12
13
14
15
16
17
18
19
20
21
22
23
24
25
26
27
28
29
30
31
32
33
34
35
说明
prometheus.NewSummary:Summary指标构造函数Objectives:Objectives字段是一个map[float64]float64类型的映射,用于定义每个分位数和其允许的误差范围。在上述示例中,我们定义了三个分位数,分别是50%(中位数)、90%和99%,并指定了相应的误差范围。resTimeHistogram.Observe(v):用于给边界值赋值
# 3.3 指标标签
Prometheus中标签分为两种:
- 静态标签: constLabels, 在指标创建时, 就提前声明好, 采集过程中永不变动。
- 动态标签: variableLabels, 用于在指标的收集过程中动态补充标签,。
如果想要指标支持动态标签,则需要使用专有的指标数据类型构造函数,对应结构如下:
NewGauge() --> NewGaugeVec()
NewCounter() --> NewCounterVec()
NewSummary() --> NewSummaryVec()
NewHistogram() --> NewHistogramVec()
2
3
4
# 3.4 指标注册
# 3.4.1 默认注册表
上面我们介绍示例中,指标注册 我们一直使用的是prometheus.MustRegister方法,这是Prometheus默认注册方法的其中一个:
// 指标注册接口
type Registerer interface {
	// 注册采集器, 有异常会报错
	Register(Collector) error
	// 注册采集器, 有异常会panic
	MustRegister(...Collector)
	// 注销该采集器
	Unregister(Collector) bool
}
2
3
4
5
6
7
8
9
# 3.4.2 自定义注册表
在Prometheus的Go语言客户端库中,您可以创建自定义的注册表(Registry)来管理和注册指标。自定义注册表允许您将指标组织到不同的注册表中,以便更好地管理和控制指标的生命周期,要创建自定义注册表,可以使用prometheus.NewRegistry函数。
package main

import (
	"net/http"

	"github.com/prometheus/client_golang/prometheus"
	"github.com/prometheus/client_golang/prometheus/promhttp"
)

func main() {
	// 创建自定义注册表
	customRegistry := prometheus.NewRegistry()

	// 创建自定义指标
    requestCounter := prometheus.NewCounter(prometheus.CounterOpts{
		Name: "http_requests_total",
		Help: "Total number of requests",
	})

	// 注册自定义指标到自定义注册表
	customRegistry.MustRegister(requestCounter)
    // 赋值
	for i := 0; i < 10; i++ {
		requestCounter.Inc()
	}

	// 创建HTTP处理器并设置指标路径
	http.Handle("/metrics", promhttp.HandlerFor(customRegistry, promhttp.HandlerOpts{
        Registry: customRegistry}))

	// 启动HTTP服务器并监听端口
	http.ListenAndServe(":8080", nil)
}
2
3
4
5
6
7
8
9
10
11
12
13
14
15
16
17
18
19
20
21
22
23
24
25
26
27
28
29
30
31
32
33
注意
通过自定义注册表注册指标时,会少很多默认的指标,但是暴露指标的时候必须通过调用 promhttp.HandleFor() 函数来创建一个专门针对我们自定义注册表的 HTTP 处理器,我们还需要在 promhttp.HandlerOpts 配置对象的 Registry 字段中传递我们的注册表对象
# 3.5 采集器
在Prometheus中,采集器(Collector)是用于收集指标数据的组件。Prometheus客户端库提供了一些内置的采集器,用于收集默认指标(如Go运行时指标)和常见的系统指标(如CPU、内存等)。此外,我们也可以自定义自己的采集器来收集特定应用程序的指标数据。
内置的采集器是通过实现prometheus.Collector接口来定义的,其中最常用的实现是prometheus.Collector接口的子接口prometheus.Collector。它包含一个Collect方法,该方法负责收集指标数据并将其发送给Prometheus服务器。
- 采集器Collector接口声明
type Collector interface {
	// 指标的一些描述信息, 就是# 标识的那部分
	// 注意这里使用的是指针, 因为描述信息 全局存储一份就可以了
	Describe(chan<- *Desc)
	// 指标的数据, 比如 http_requests_total 10
	// 这里没有使用指针, 因为每次采集的值都是独立的
	Collect(chan<- Metric)
}
2
3
4
5
6
7
8
- 应用示例
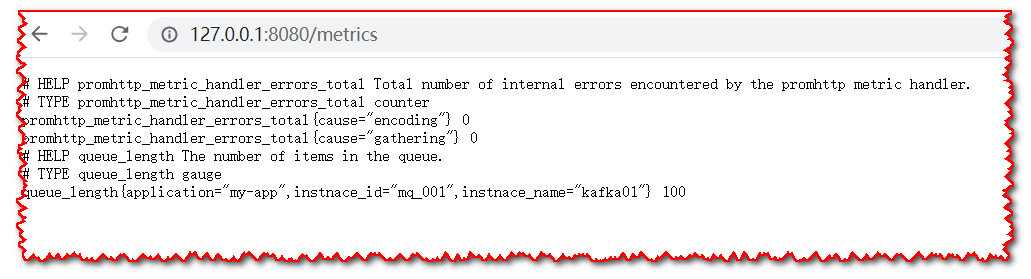
DemoCollector结构体实现了prometheus.Collector接口的Describe和Collect方法。在Describe方法中,我们将自定义Counter指标的描述发送到ch通道中。在Collect方法中,我们增加了自定义Counter指标的值,并将其发送到ch通道中。
package main

import (
 "net/http"

 "github.com/prometheus/client_golang/prometheus"
 "github.com/prometheus/client_golang/prometheus/promhttp"
)


// DemoCollector结构体
type DemoCollector struct {
	queueLengthDesc *prometheus.Desc
	labelValues     []string
}
// DemoCollector结构体构造函数
func NewDemoCollector() *DemoCollector {
	return &DemoCollector{
		queueLengthDesc: prometheus.NewDesc(
			"queue_length",
			"The number of items in the queue.",
			// 动态标签的key列表
			[]string{"instnace_id", "instnace_name"},
			// 静态标签
			prometheus.Labels{"application": "http-server"},
		),
		// 动态标的value列表, 这里必须与声明的动态标签的key一一对应
		labelValues: []string{"mq_001", "kafka01"},
	}
}

func (c *DemoCollector) Describe(ch chan<- *prometheus.Desc) {
	ch <- c.queueLengthDesc
}

func (c *DemoCollector) Collect(ch chan<- prometheus.Metric) {
	ch <- prometheus.MustNewConstMetric(c.queueLengthDesc, prometheus.GaugeValue, 100, c.labelValues...)
}


func main() {
	// 创建一个自定义的注册表
	registry := prometheus.NewRegistry()

	// 可选: 添加 process 和 Go 运行时指标到我们自定义的注册表中 新版本NewProcessCollector已经移除
	registry.MustRegister(prometheus.NewProcessCollector(prometheus.ProcessCollectorOpts{}))
	registry.MustRegister(prometheus.NewGoCollector())

	// 注册自定义采集器
	registry.MustRegister(NewDemoCollector())

	// 暴露指标
	http.Handle("/metrics", promhttp.HandlerFor(registry, promhttp.HandlerOpts{Registry: registry}))
	http.ListenAndServe(":8080", nil)
 }
2
3
4
5
6
7
8
9
10
11
12
13
14
15
16
17
18
19
20
21
22
23
24
25
26
27
28
29
30
31
32
33
34
35
36
37
38
39
40
41
42
43
44
45
46
47
48
49
50
51
52
53
54
55
56
说明
prometheus.NewDesc函数:
func NewDesc(fqName, help string, variableLabels []string, constLabels Labels) *Desc {
	return V2.NewDesc(fqName, help, UnconstrainedLabels(variableLabels), constLabels)
}
2
3
Describe: 将自定义Counter指标的描述发送到ch通道中.
Collect: 自定义Counter指标的值、标签,并将其发送到ch通道中.
labelValues: 动态标签。从结构体的字段labelValues中获取,也是我们自己传入prometheus.NewDesc函数中的切片